Old-School Front-End · Frameworks / 2026 ・ No.08
Old-School Front-End: Frameworks
Part 8: The cost of re-rendering — memo, useCallback, React Compiler, and the browser
Published
In part 5 we counted that one keystroke re-renders every component. Part 8 measures how much time that actually takes and compares how far memo, useCallback and React Compiler 1.0 bring it down.
The short answer: with the claim form's three rows, everything takes about 2 ms and nothing needs fixing. Differences appear past 100 rows. And at 1000 rows, making React faster left the browser's drawing time untouched.
Measure before fixing
AraiRe-rendering everything for one keystroke is wasteful. I'll put memo on every component!
FuruiBefore you do, can you say how many milliseconds it takes now?
The 15-part route map (you are here: part 8)
# Calls per keystroke in row 1's amount, claim form with three lines (production)
  component         as is                     Compiler (part 7 App)     Compiler (fixed App)
  App               1                         1                         1
  AboutSection      1                         1                         0
  ItemsSection      1                         1                         1
  ItemTable         1                         1                         1
  ItemRow           3                         3                         3
  TotalLine         1                         1                         1
  ReceiptSection    1                         1                         0
  SendButtons       1                         1                         0
  JS per key        1.95 ms                   2.09 ms                   1.81 ms
# With three rows it's about 2 ms either way; nobody could tell
Measured on part 7's claim form (three line items), each keystroke costs about 2 ms of JavaScript. At 60 frames a second, each frame has about 16 ms to spend; we use an eighth of it. Change anything here and nobody will notice. This time we add rows to find where people start to notice.
The measuring tools
const onRender = (id, phase, actualDuration, baseDuration) => …; // record the render time (ms)

<Profiler id="rows" onRender={onRender}>
  <table> … </table>
  <TotalLine … />
</Profiler>
React has a <Profiler> component that reports how long its contents took to render (actualDuration) each time. The Profiler tab in React Developer Tools records the same way.
// Part 8: switches for measuring (normally neither is set)
//   COMPILER=1 … run React Compiler (the Babel plugin)
//   PROFILE=1  … use the react-dom build that calls <Profiler>'s onRender even in production
const compiler = process.env.COMPILER === '1'
const profile = process.env.PROFILE === '1'

// https://vite.dev/config/
export default defineConfig({
  plugins: [react(), ...(compiler ? [babel({ presets: [reactCompilerPreset()] })] : [])],
  resolve: profile ? { alias: { 'react-dom/client': 'react-dom/profiling' } } : {},
  server: { … },
  build: {
    rolldownOptions: { input: { main: 'index.html', lab: 'lab.html' } }, // Part 8: build the experiment pages for production too
  },
})
In a production build, though, Profiler normally does nothing. Swap in react-dom/profiling and you can measure production too. We don't measure in dev because, as section 3 shows, dev is several times slower thanks to StrictMode and its checks. As in part 3, times come from a Chromium trace, split into "JavaScript" and "drawing" (Layout, Paint and so on), per keystroke.
More rows
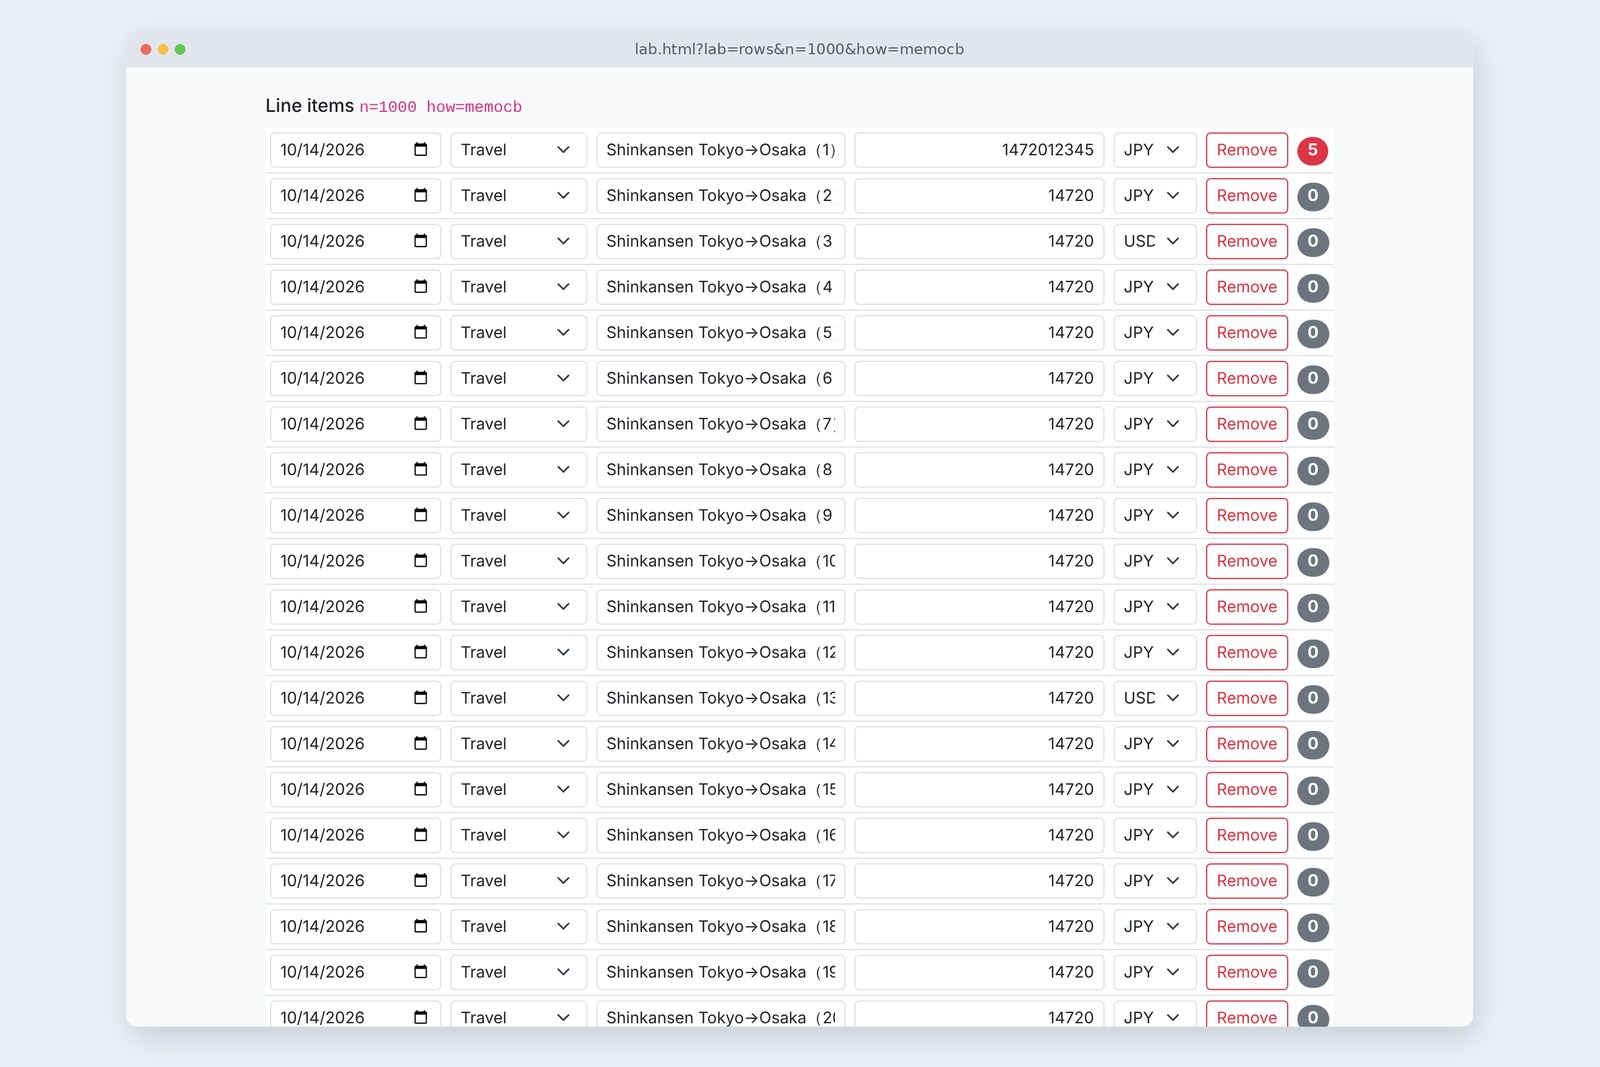
The experiment page lab.html?lab=rows uses the claim form's own ItemRow and TotalLine, at 10, 100 or 1000 rows.
# lab.html?lab=rows: time per keystroke in row 1's amount (production, Chromium trace, median of 3)
  rowsJS          drawing (browser)ItemRow calls
  102.34 ms     1.88 ms10
  1007.2 ms      10.95 ms100
  100047.15 ms    50.92 ms1000
  1000 (dev)308.59 ms   54.63 ms2000
# Drawing is Layout and Paint. At 1000 rows the total is about 100 ms per keystroke
# Dev calls everything twice (StrictMode) and runs dev checks: about 6.5× production's JS
At 100 rows, 7 ms of JS; at 1000, 47 ms. All 999 rows you aren't typing in still call ItemRow every time. Easy to miss is the right-hand column: the browser's drawing takes another 51 ms. About 100 ms in all, and you can see the typed characters lag behind.
memo alone saves nothing
Following Arai's plan, ItemRow went into memo. memo reuses the last result without calling the component when its props are the same as before.
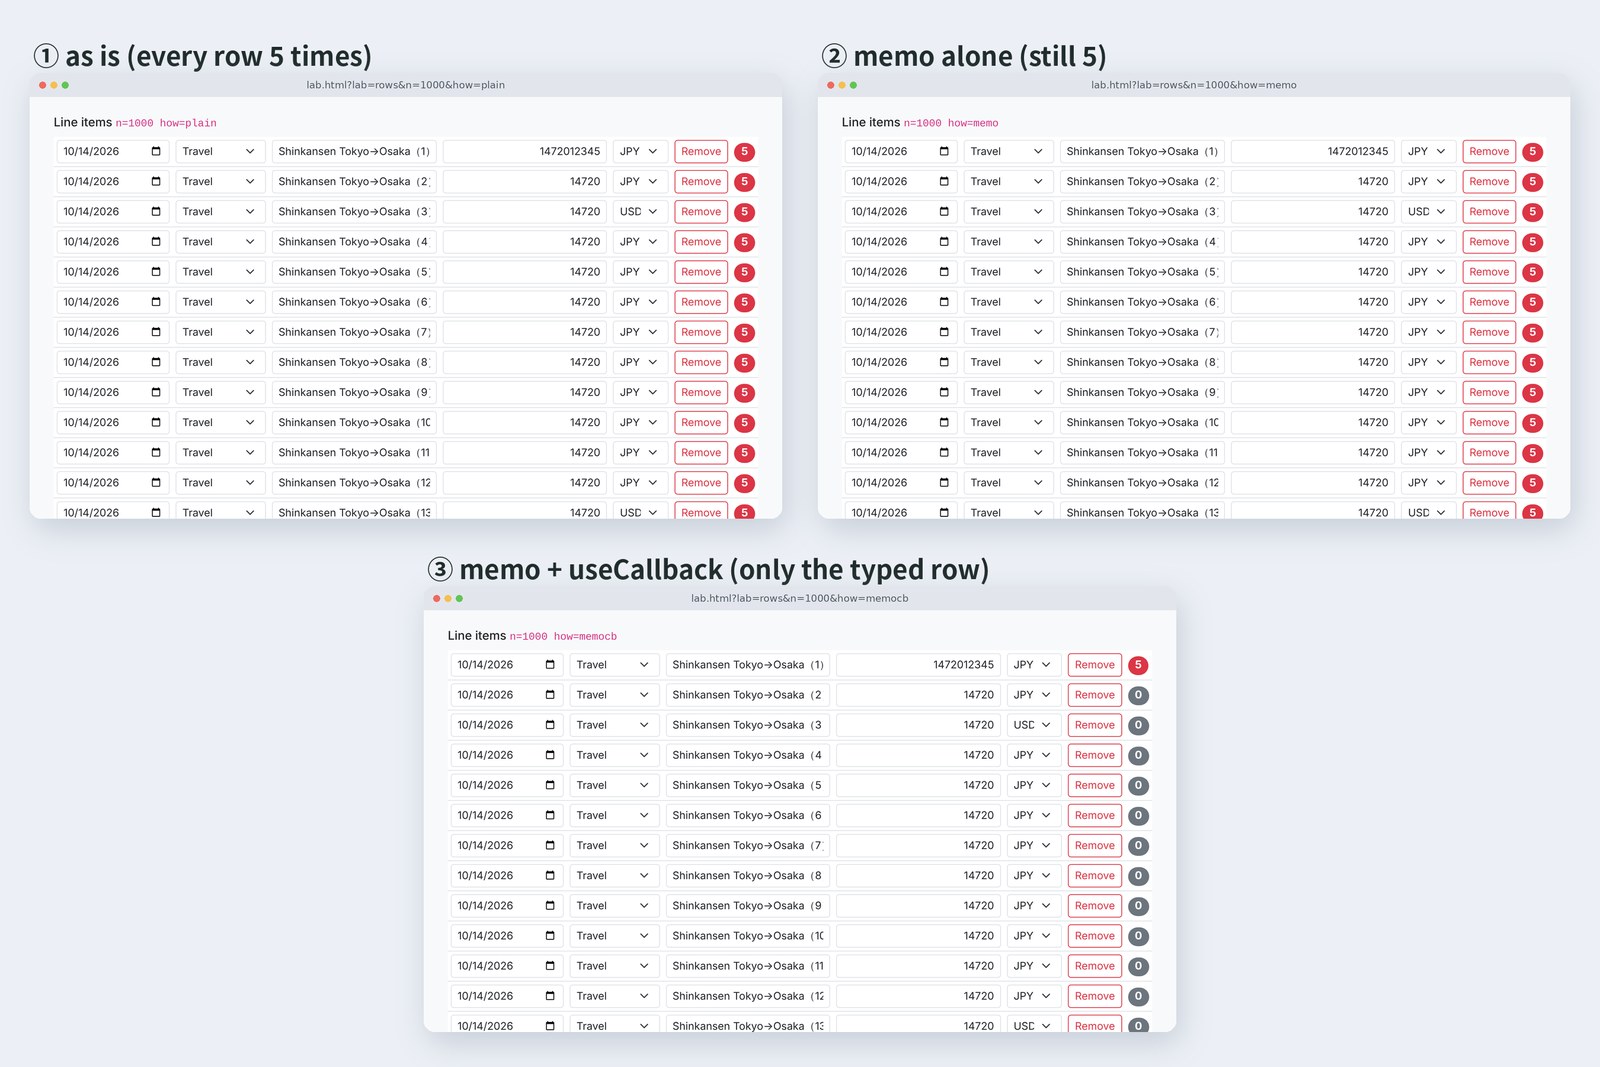
As ② shows, not a single row was saved. It's even a little slower, from comparing props (JS 47 → 52 ms).
memo compares props one by one
The culprit is the functions App recreates on every render. onChange, onRemove and errorOf do the same thing each time, but each render makes a new, different function. memo asks "is it the same object?", so the answer is no.
Keeping functions the same
const MemoRow = memo(ItemRow); // if the props match last time's, don't call ItemRow at all

  // plain, memo: written like part 7's App. Every render makes new functions
  const changeEach = (id, name, value) => setRows(rows.map((r) => (r.id === id ? { ...r, [name]: value } : r)));
  const removeEach = (id) => setRows(rows.filter((r) => r.id !== id));
  const errorOfEach = () => undefined;

  // memocb: take the previous value (prev => …), no rows needed, so the function can stay the same one
  const changeOnce = useCallback((id, name, value) => setRows((prev) => prev.map((r) => (r.id === id ? { ...r, [name]: value } : r))), []);
  const removeOnce = useCallback((id) => setRows((prev) => prev.filter((r) => r.id !== id)), []);
useCallback makes a function once and hands back the same one on later renders. But if it uses rows inside, it has to be remade whenever rows changes, or it sees stale rows. So we switch to part 5's option ④, taking the previous value (setRows((prev) => …)). With no rows inside, one function is enough for good.
# 1000 rows, per keystroke in row 1's amount (production, median of 3)
  how                           JS        drawing   React     ItemRow
  ① as is47.1      50.9      23.6      1000
  ② memo alone52.0      54.1      26.7      1000
  ③ memo + useCallback3.0       51.9      1.5       1
  ④ Compiler (code ①)39.9      48.8      20.2      1000
  ⑤ Compiler (prev => only)6.9       49.8      5.5       1000
  ⑥ Compiler + ③3.1       50.5      1.4       1
  ⑦ ③ + visible rows only2.6       2.9       1.2       1
# Units: ms. React is <Profiler>'s actualDuration (measured separately on a profiling build). ItemRow is the number of calls
With ③, one ItemRow is called per keystroke and JS falls from 47 ms to 3 ms (React's share from 23.6 to 1.5 ms). The answer of sections 4 and 5: memo only works once all the props line up.
# By number of rows (JS, ms per keystroke)
  how                           10 rows   100 rows  1000 rows
  ① as is2.3       7.2       47.1
  ② memo alone1.8       9.5       52.0
  ③ memo + useCallback1.8       1.3       3.0
  ④ Compiler (code ①)2.4       6.1       39.9
  ⑥ Compiler + ③1.4       1.3       3.1
# At 10 rows everything is about 2 ms; differences show from 100 rows
Leaving it to React Compiler
Deciding where to put memo and useCallback is tedious. React Compiler, 1.0 since October 2025, rewrites components at build time and adds "if it's the same as last time, reuse the last result" for you. In Vite it goes in as a Babel plugin, as in section 2's config (COMPILER=1).
Rows ④ to ⑥ of section 5's table are the results. ④, code ① passed through unchanged, went from 47 to 40 ms: only a little, because the functions use rows and the compiler has to remake them each time too. But ⑤, where the functions merely take the prev => form (no memo, no useCallback), fell to 7 ms. ItemRow is still called 1000 times, but its inputs haven't changed, so the compiled code returns the remembered result at once. ⑥, combined with the hand-written ③, was about the same as ③.
# npm run build (3 runs) and the claim form's JavaScript (main-*.js)
                    build time              main-*.js
  no Compiler       1.35〜1.95 s11.91 kB
  with Compiler     3.06〜3.48 s15.48 kB  + compiler-runtime 0.23 kB
# The shared part (React and co., 211 kB) is the same; the Compiler adds memo caches and comparisons
The price: builds take about twice as long, and the claim form's JavaScript grows by 3.6 kB.
The compiler skipped App
Look at section 1's table again. Even through the Compiler, part 7's App still had all eight components called. Let's have the compiler report what it did, component by component.
// Show which components React Compiler could rewrite to remember things (and which it couldn't) (part 8)
// usage: node scripts/rc-log.mjs src/App.jsx src/components/*.jsx
import { transformSync } from '@babel/core';
import fs from 'node:fs';
import path from 'node:path';

for (const file of process.argv.slice(2)) {
  const events = [];
  transformSync(fs.readFileSync(file, 'utf8'), {
    filename: file, babelrc: false, configFile: false, parserOpts: { plugins: ['jsx'] },
    plugins: [['babel-plugin-react-compiler', { logger: { logEvent: (_, e) => events.push(e) } }]],
  });
  for (const e of events) {
    if (e.kind === 'CompileSuccess') console.log(`${path.basename(file).padEnd(20)}${e.kind.padEnd(16)}${e.fnName}  slots=${e.memoSlots}`);
    else console.log(`${path.basename(file).padEnd(20)}${e.kind}\n  └ ${e.detail?.reason ?? e.detail?.options?.reason ?? ''}`); // why it couldn't
  }
}
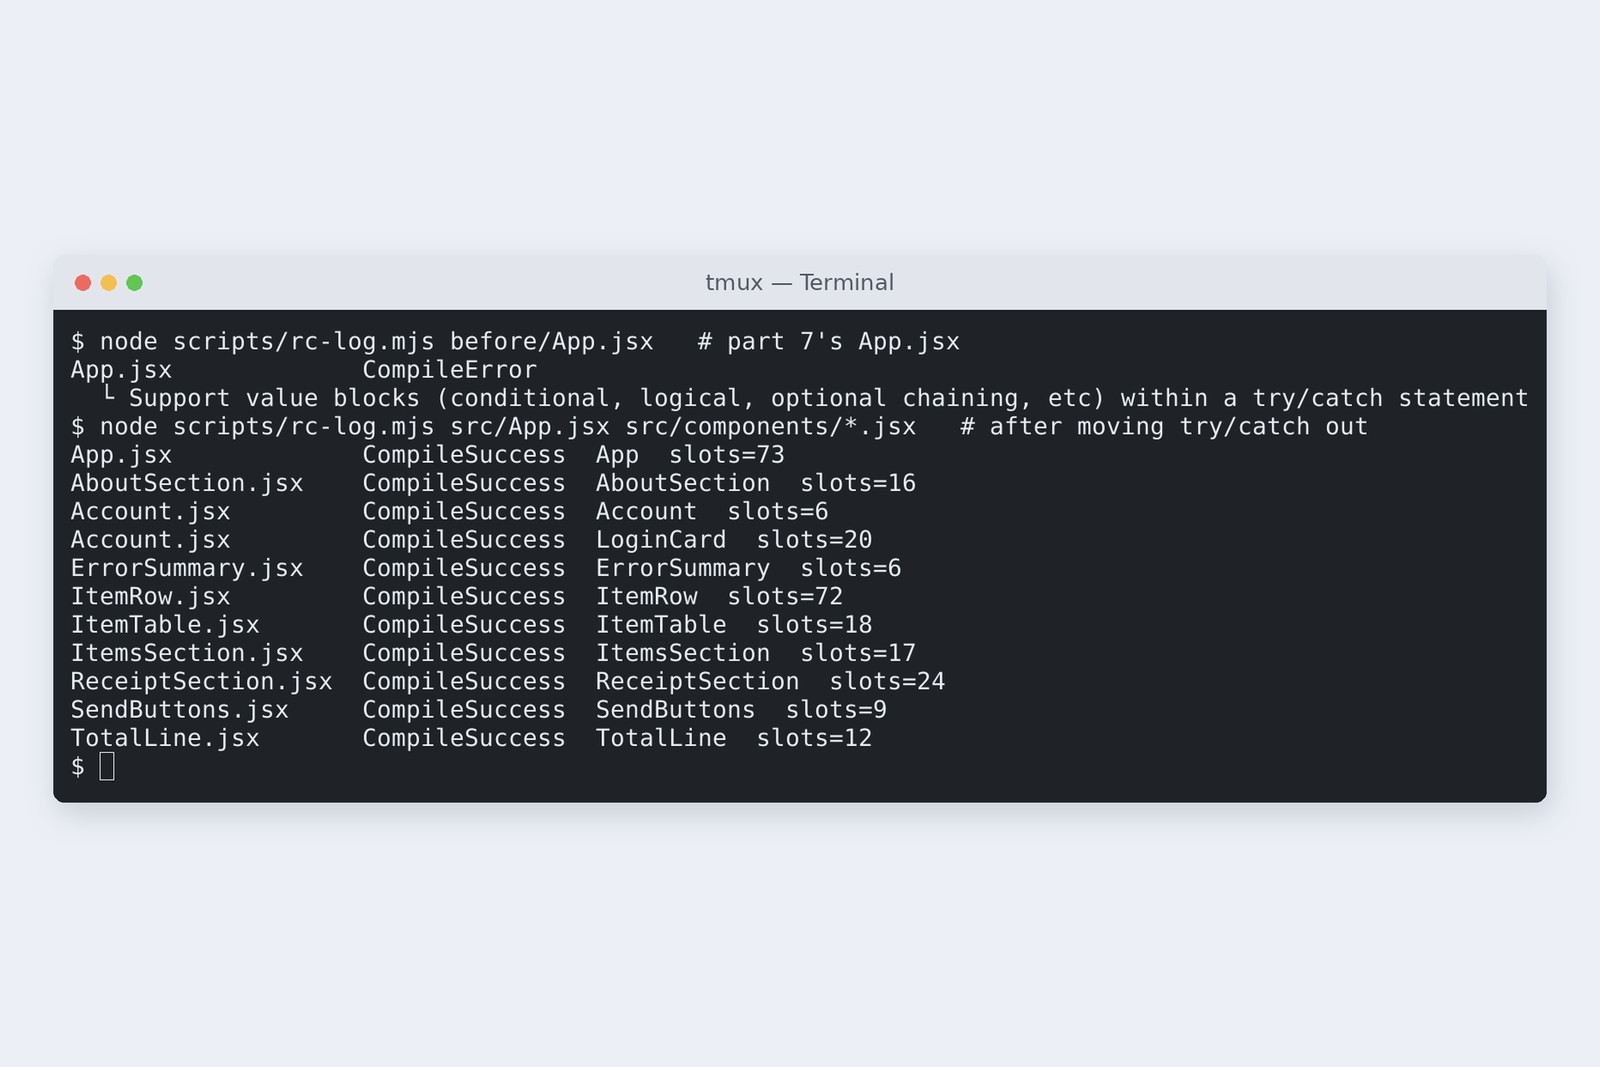
Part 7's App.jsx got a CompileError and was built as it was, remembering nothing. The reason: conditional expressions (?? and friends) inside a try/catch aren't supported yet. That's the try/catch part 7's submitClaim uses to catch a 401. The build succeeds and nothing warns you, so you'd never know without checking like this.
/** Send to Spring Boot; null if the sign-in expired (part 8: try/catch moved out of the component so React Compiler doesn't skip App) */
async function trySend(body, files) {
  try {
    return await sendClaim(body, files);
  } catch (e) {
    if (e instanceof SignedOut) return null;
    throw e;
  }
}

// inside App
  // Part 8: take the previous value (prev). No rows, so React Compiler can keep the function the same
  const change = (id, name, value) => setRows((prev) => prev.map((r) => (r.id === id ? { ...r, [name]: value } : r)));
  const add = () => {
    const row = newRow(); // make the new row outside (prev => … must give the same result if called twice)
    setRows((prev) => [...prev, row]);
  };
  const remove = (id) => {
    const empty = newRow();
    setRows((prev) => {
      const rest = prev.filter((r) => r.id !== id);
      return rest.length > 0 ? rest : [empty];
    });
  };
Move the try/catch into trySend, a function outside the component, and App compiles too; as the right-hand column of section 1's table shows, the purpose and receipt components are no longer called. change, add and remove also took the prev => form. The new row is made outside and passed in, because whatever runs inside prev => … must give the same result if StrictMode calls it twice.
What's left is the browser
Time per keystroke at 1000 rows
memo and the Compiler alike only shrank the red (JS); the grey drawing stayed at about 50 ms. The trace shows Layout at 22 ms and Paint at 20 ms. Change the text in one box of a 1000-row table and the browser recomputes the whole table's layout and repaints it (table-layout: fixed or a fixed-height box barely helped).
The only cure is to hand the browser fewer rows. ⑦ draws only the 20 rows in view inside a 600px-high box, padding above and below with empty rows of the right height (the idea behind "virtual scrolling" in list screens). Per keystroke: 98 → 5 ms.
# Just the total (calcTotal), timed 2000 times in Node.js, per call
  10 rows     9.2 µs
  100 rows   50.0 µs
  1000 rows  453.6 µs
# 0.45 ms even at 1000 rows: next to 100 ms per keystroke, useMemo buys nothing
While we were at it, we checked whether the total deserves useMemo. Even at 1000 rows it takes 0.45 ms. Reach for useMemo once you've measured a calculation and found it heavy.
For this app
- No hand-written memo or useCallback — line items top out at 10, and at 10 rows every approach is about 2 ms (section 5's second table)
- Write code the compiler won't skip — try/catch outside components, state updates with prev =>. Neither hurts, and readability is unchanged
- Don't switch the Compiler on for good yet — builds take twice as long with no difference at three rows. Keep the COMPILER=1 switch and decide again in part 15, when the release setup is settled
- For screens with many rows (a claims list, say), first draw fewer rows — paginate, or draw only what's visible
On your own PC
In React Developer Tools' Profiler tab, press record, type a few characters into row 1's amount and stop: each component's time appears as a bar. Turn on "Record why each component rendered while profiling." under the gear and you also get reasons like "Props changed: (onChange)". Try it on section 4's memo-only version and the guilty function is named for you.
To measure production, use PROFILE=1 npm run build and npm run preview; to try the Compiler, add COMPILER=1. npm run rc-log shows how the compiler treated each component.
§ — On one page, and next time
- Measure in production before fixing. The claim form's three rows took about 2 ms: nothing to fix. Dev is about 6.5× slower.
- memo alone saves nothing when every render passes new functions: the props always differ.
- Keep functions the same with useCallback and prev =>: JS 47 → 3 ms at 1000 rows.
- React Compiler needs just the prev form: 47 → 7 ms. But it quietly skipped an App containing try/catch.
- A faster React leaves the browser's drawing (about 50 ms). To cut it, draw fewer rows.
AraiGlad I didn't memo everything… By the way, I'd like the signed-in name in the header too.
FuruiThat means passing props down several levels from App. Next time: where state lives. Context and useReducer, and the approval status changes on screen too.
References
- React — memo
- React — useCallback
- React — useMemo
- React — <Profiler>
- React — React Compiler
- React Blog — React Compiler v1.0(2025-10-07)
- @vitejs/plugin-react — React Compiler
- web.dev — Rendering performance
Recorded by the author on a cloud Linux machine on 3 November 2026. An experiment page and babel-plugin-react-compiler 1.0.0 (with @rolldown/plugin-babel 0.2.4 and @babel/core 8.1.0) were added to part 7's project (Vite 8.3.5, React 19.3.1). Production builds were served with npm run preview and opened in Chromium 153.0.8010.12 driven by Playwright, sending input events one character at a time. Times per keystroke come from Chromium traces (devtools.timeline), median of three runs. The claim form measurements were connected to the back-end series' Spring Boot app.
Old-School Front-End, Frameworks part 8 — The cost of re-rendering / 2026.11